ssd_kerasで学習を行う際には,物体の座標情報などをまとめたXMLファイルが必要になります。最初は他の方が作ったプログラムを使おうと思っていたのですが,GUIを作成するためのプログラムを別途インストールしないといけなかったり,試しても上手く動作してくれなかったりしたので,結局自作してしまいました。
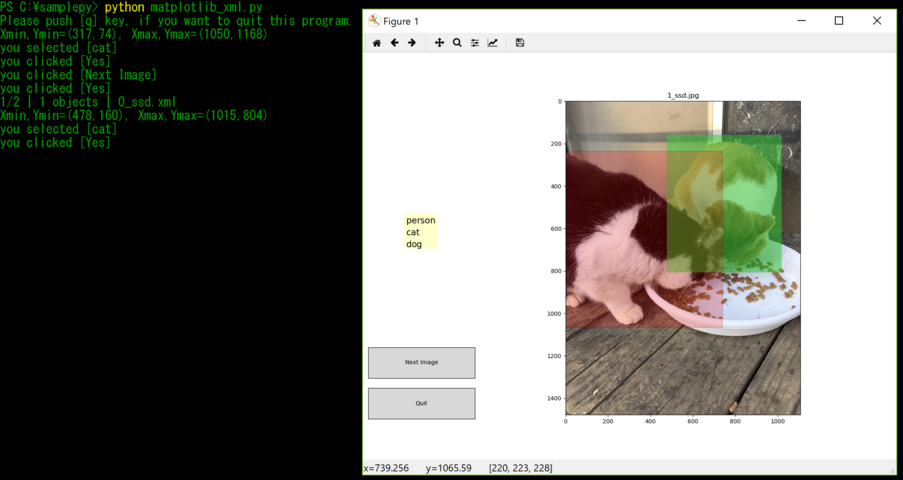 こんな感じ
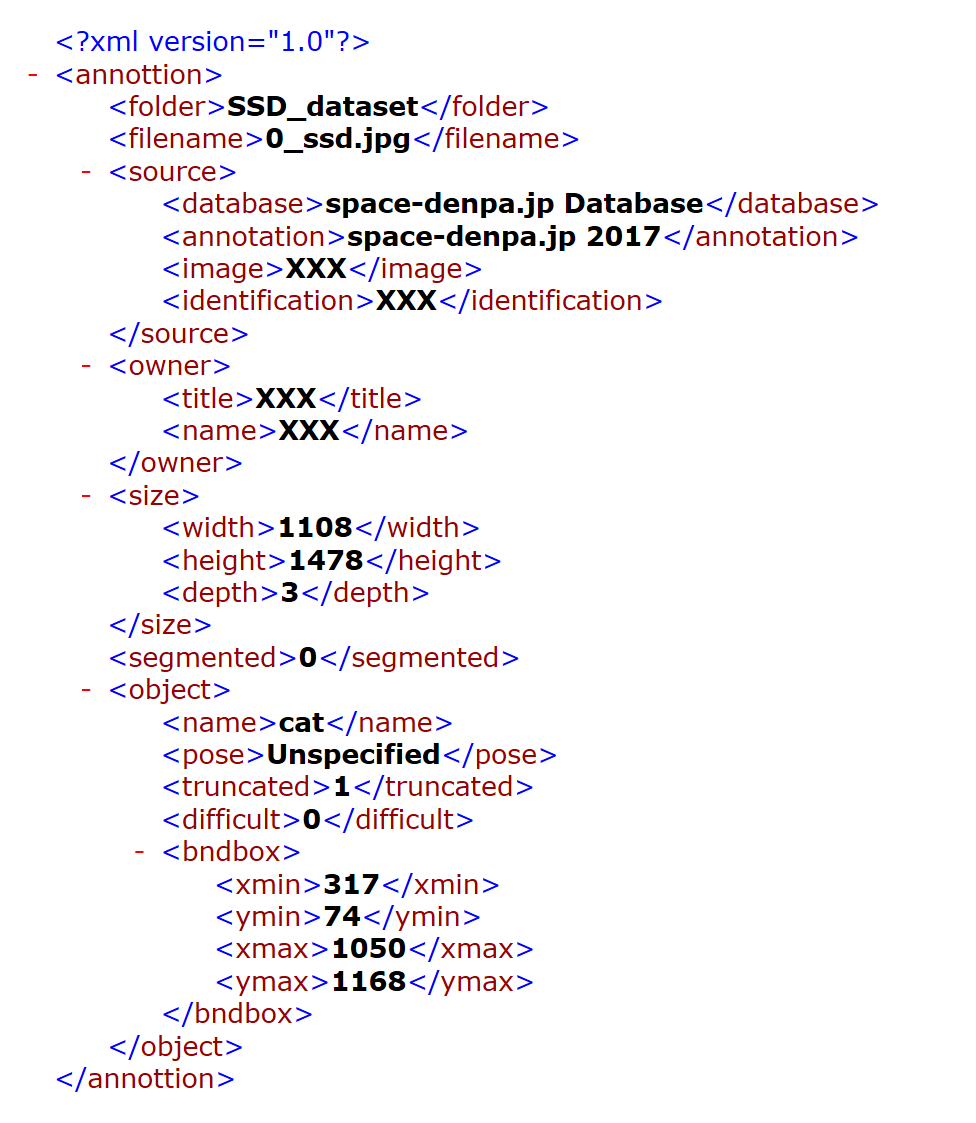
こんな感じ
作成されるXMLファイルはVOC2007の形式とほぼ同じです。
参考にしたサイト
- Matplotlibのプロット上でのGUIによるボックス矩形選択(矩形選択モジュールとしてほぼそのまま使用させていただきました。)
- PythonのTkinterを使ってみる
- widgets example code: menu.py(少し弄ってリストボックスとして利用しました。)
- ButtonsButtons ー Matplotlib 2.1.1 documentation
動作環境
MatplotlibとTkinterが動作する環境なら使えるはずです。
以下のようなディレクトリ構造を作って画像を入れておくと,パスを取得して勝手にリネーム&移動までやってくれます。
<C:>
 | - <samplepy>
 |    | - xml_maker.py  # 今回作ったやつ
 |    | - rectselect.py
 |    | - matplotlib_menu.py
 |
 | - <Machine_Learning_data>
 |    | - <ssd_ori_images>  # これから選別する画像を入れておく
 |    | - <ssd_image_data>  # 選別した画像はここに移動される
 |    | - <ssd_xml_data>  # 作成したXMLファイルを保存
xml_maker.py が今回作成したプログラムです。
rectselect.py が矩形選択を行うために拝借したプログラムで,matplotlib_menu.py はリストボックスを表示するためにMatplotlib公式のサンプル集から拝借しました。これら2つは xml_maker.py からモジュールとしてインポートして使用しています。
いろいろやってこうなった
import shutil
import numpy as np
import os, sys, glob
import tkinter as tk  # 確認ボタン
import matplotlib.pyplot as plt
from PIL import Image
from matplotlib.widgets import Button
from xml.etree import ElementTree as ET

# 矩形選択モジュール
from rectselect import RectSelect
# メニューボタン表示モジュール
from matplotlib_menu import ItemProperties, MenuItem, Menu

# アノテーションデータを作る画像のある階層
img_ori_dir = 'C:/Machine_Learning_data/original_images'
# リネームした画像の保存先
img_save_dir = 'C:/Machine_Learning_data/ssd_image_data'
# XMLファイルの保存先
xml_save_dir = 'C:/Machine_Learning_data/ssd_xml_data'
# 分類クラス
detect_classes = ['person','cat','dog']
# ファイル名末端文字(315_ssd.jpg, 315_ssd.xmlって感じ)
name_last = '_ssd'

# 画像パスを取得
img_files = glob.glob(img_ori_dir + '/*.jpg')
total_num = len(img_files)
total_object = 0
func_num = 0 # 枚数計算

# 各カテゴリのオブジェクト数を数える変数と初期値
object_count = []
for i , category in enumerate(detect_classes):
    cat_count = category + "_count"
    object_count.append(cat_count)  # object_count = [person_count, cat_count, ...]
    object_count[i] = 0
del cat_count

print('Please push [q] key, when you want to quit this program.')
# キーボード入力で終了
def on_key_event(event):
    global BREAK_FLAG
    print('you pressed', event.key)
    if event.key == 'q':
        BREAK_FLAG = True
        plt.close(event.canvas.figure)
    sys.stdout.flush()

# 画像ごとにループ
for name_num, img_path in enumerate(img_files):
    BREAK_FLAG = False  # Trueの時にbreak
    object_num = 0
    # ファイル名のだぶり回避
    while True:
        # rename後のだぶり回避
        if os.path.exists(img_ori_dir + '/' + str(name_num)  + name_last + '.jpg'):
            name_num += 1
        # move先のだぶり回避
        elif os.path.exists(img_save_dir + '/' + str(name_num) + name_last + '.jpg'):
            name_num += 1
        # XMLファイルのだぶり回避
        elif os.path.exists(xml_save_dir + '/' + str(name_num) + name_last + '.xml'):
            name_num += 1
        else:
            break

    # 画像読み込み
    img = Image.open(img_path)
    # 画像名を連番で保存
    img_renamed = str(name_num) + name_last + '.jpg'

    # ---------画像詳細を示すXMLタグを作成------------ #
    root = ET.Element("annottion")
    # 置き場とか.
    folder = ET.SubElement(root, 'folder')
    folder.text = 'SSD_dataset'  # データセットのある階層
    filename = ET.SubElement(root, 'filename')
    filename.text = img_renamed  # 画像名
    # 出典
    source = ET.SubElement(root, 'source')
    database = ET.SubElement(source, 'database')
    database.text = 'space-denpa.jp Database'
    annotation = ET.SubElement(source, 'annotation')
    annotation.text = 'space-denpa.jp 2017'
    image = ET.SubElement(source, 'image')
    image.text = 'XXX'  # 出典とか
    image_ID = ET.SubElement(source, 'identification')
    image_ID.text = 'XXX'  # 元サイトでの画像IDとか.
    # データ作成者情報
    owner = ET.SubElement(root, 'owner')
    image_title = ET.SubElement(owner, 'title')
    image_title.text = 'XXX'  # 画像タイトル
    name = ET.SubElement(owner, 'name')
    name.text = 'XXX'  # 撮影者
    # 画像諸元
    size = ET.SubElement(root, 'size')
    width = ET.SubElement(size, 'width')
    width.text = str(int(img.width))  # PILより取得
    height = ET.SubElement(size, 'height')
    height.text = str(int(img.height))  # PILより取得
    depth = ET.SubElement(size, 'depth')
    depth.text = str(3)
    segmented = ET.SubElement(root, 'segmented')
    segmented.text = str(0)
    # --------------XMLタグここまで---------------- #

    # menu button plot
    fig = plt.figure(figsize=(13, 10), dpi=100)
    fig.subplots_adjust(left=0.3)
    props = ItemProperties(labelcolor='black',
                           bgcolor='yellow',
                           fontsize=15,
                           alpha=0.2)
    hoverprops = ItemProperties(labelcolor='white',
                                bgcolor='blue',
                                fontsize=15,
                                alpha=0.2)

    # Numpy配列に変換
    plt.title(img_renamed)  # タイトル
    plt.imshow(img)
    # 矩形選択
    rect_size = RectSelect()

    menuitems = []
    for label in detect_classes:
        def on_select(item):
            if hasattr(rect_size, 'x_min'):  # 矩形選択されているか調べる
                print('you selected [%s]' % item.labelstr)

                def yes_on_press():  # plot by Tkinter
                    """Yesの処理(XMLツリーを追加)"""
                    print('you clicked [Yes]')
                    global object_num
                    object_num += 1
                    # -------オブジェクト詳細を示すXMLタグを追加-------- #
                    # オブジェクト名,その他
                    object_info = ET.SubElement(root, 'object')
                    name = ET.SubElement(object_info, 'name')
                    name.text = str(item.labelstr) # メニューボタンで選択したオブジェクト名
                    pose = ET.SubElement(object_info, 'pose')
                    pose.text = 'Unspecified'  # rightとかleftとか.
                    truncated = ET.SubElement(object_info, 'truncated')
                    truncated.text = str(1)  # 全部写ってたら0, 写ってない部分があれば1(たぶん)
                    difficult = ET.SubElement(object_info, 'difficult')
                    difficult.text = str(0) # 同じ物体が他にもあれば1,無ければ0
                    # オブジェクトサイズ
                    bndbox = ET.SubElement(object_info, 'bndbox')
                    xmin = ET.SubElement(bndbox, 'xmin')
                    xmin.text = str(int(rect_size.x_min))  # RectSelectモジュールの返り値
                    ymin = ET.SubElement(bndbox, 'ymin')
                    ymin.text = str(int(rect_size.y_min))
                    xmax = ET.SubElement(bndbox, 'xmax')
                    xmax.text = str(int(rect_size.x_max))
                    ymax = ET.SubElement(bndbox, 'ymax')
                    ymax.text = str(int(rect_size.y_max))
                    # --------XMLタグここまで--------- #
                    root_tag_conf.destroy()  # ウィンドウを閉じる
                    root_tag_conf.quit()  # mainloopを抜ける

                    # count object number
                    for i, category in enumerate(detect_classes):
                        if category == item.labelstr:
                            object_count[i] += 1

                def no_on_press():  # plot by Tkinter
                    print('you clicked [No]')
                    root_tag_conf.destroy()
                    root_tag_conf.quit()

                # 確認ボタンを表示
                root_tag_conf = tk.Tk()  # ここからroot_tag_conf.mainloopまでをループ.
                root_tag_conf.geometry("500x110")  # 500px * 110px
                root_tag_conf.wm_title(str(item.labelstr) + "?")
                conf_y_button = tk.Button(root_tag_conf, text='Yes', command=yes_on_press)
                conf_y_button.pack(fill='both')
                conf_n_button = tk.Button(root_tag_conf, text='No',  command=no_on_press)
                conf_n_button.pack(fill='both')
                root_tag_conf.mainloop()

            else:  # 何も選択していない場合.
                print('No object selected.')
                print('If object is not exsists, please click [Next Image] button.')

        item = MenuItem(fig, label, props=props,
                        hoverprops=hoverprops,
                        on_select=on_select)
        menuitems.append(item)
    menu = Menu(fig, menuitems)

    class Index(object):
        def quit_on_press(self, event):
            global BREAK_FLAG
            BREAK_FLAG = True
            print('you clicked [Quit]')
            plt.close(event.canvas.figure)
            sys.stdout.flush()

        def next_on_press(self, event):
            """Confirmation Button [Yes]"""
            print('you clicked [Next Image]')
            def next_yes():
                print('you clicked [Yes]')
                root_next_conf.destroy()
                root_next_conf.quit()
                plt.close(event.canvas.figure)
                sys.stdout.flush()

            def next_no():
                """Confirmation Button [No]"""
                print('you clicked [No]')
                root_next_conf.destroy()
                root_next_conf.quit()

            root_next_conf = tk.Tk()
            root_next_conf.geometry("500x110")  # 500px * 110px
            root_next_conf.wm_title("Really?")
            conf_y_button = tk.Button(root_next_conf, text='Yes', command=next_yes)
            conf_y_button.pack(fill='both')
            conf_n_button = tk.Button(root_next_conf, text='No', command=next_no)
            conf_n_button.pack(fill='both')
            root_next_conf.mainloop()

    callback = Index()
    # plt.axes([左,下,幅,高さ])
    ax_quit = plt.axes([0.01, 0.1, 0.2, 0.075])
    ax_next = plt.axes([0.01, 0.2, 0.2, 0.075])
    next_button = Button(ax_next, 'Next Image')
    next_button.on_clicked(callback.next_on_press)
    quit_button = Button(ax_quit, 'Quit')
    quit_button.on_clicked(callback.quit_on_press)

    plt.show()

    total_object += object_num

    del rect_size
    if object_num == 0:  # オブジェクト無しなら保存しないで次の画像
        print("object is not exists, so didn't save.")
        if BREAK_FLAG == True:
            break
        continue

    else:
        func_num += 1
        # 連番で保存
        tree = ET.ElementTree(root)
        tree.write(xml_save_dir + '/' + str(name_num) + name_last + '.xml')
        # 画像リネーム&移動
        os.rename(img_path, img_ori_dir + '/' + img_renamed)
        shutil.move(img_ori_dir + '/' + img_renamed, img_save_dir)  # shutil.move('元', '移動先')

        # 途中結果(オブジェクトの数とか)
        print(str(func_num) + '/' + str(total_num),'|',object_num, 'objects',
              '|',str(name_num) + name_last + '.xml')

        if BREAK_FLAG == True:
            break

# 最終結果
print("-" * 30,"Processing-Exit","-" * 30)
if func_num > 0 :
    if total_object == 0:
        print("object is not exists, so didn't save.")
    else:
        print("Ok!")
        for i in range(len(detect_classes)):
            print(str(detect_classes[i]) + ":" + str(object_count[i]),"," ,end=" ")
        print("\n")
        print(func_num, "Images & Annotations are succcessfully saved.")
        print("Annotations:", xml_save_dir)
        print("Images:", img_save_dir)
else :
    print("Image is not exists!")
280行ありますが,XMLツリーの構築やボタンの表示の部分で同じような記述を繰り返しているので,内容的にはそこまで多くありません。
XMLタグの作成部分で,’space-denpa.jp’とか’XXX’とかなっている部分は好きなように変えて下さい。
rectselect.pyの変更部分
選択した部分の座標情報を取得できるようにしました。
def callback(self, eclick, erelease):
        x0, x1 = eclick.xdata, erelease.xdata
        y0, y1 = eclick.ydata, erelease.ydata
        self.blc = int(min(x0, x1)), int(min(y0, y1))  # もとはint無し
        self.trc = int(max(x0, x1)), int(max(y0, y1))
        blc_print = '({},{})'.format(*self.blc)  # もとは{:0.4},{:0.4}
        trc_print = '({},{})'.format(*self.trc)
        print('Xmin,Ymin={}, Xmax,Ymax={}'.format(blc_print, trc_print))

        # 後から追加
        # 右上
        self.x_max = max(x0, x1)
        self.y_max = max(y0, y1)
        # 左下
        self.x_min = min(x0, x1)
        self.y_min = min(y0, y1)
全体のプログラムは作成された方のサイトを参照してください。
matplotlib_menu.pyの変更部分
fig = plt.figure() から始まる最後の実行部分を削除しただけです。他は何も弄ってません。 menu.py
XMLファイルの作り方(割と適当)
from xml.etree import ElementTree as ET

a = str(1)

root = ET.Element("annotation")
sub0 = ET.SubElement(root, 'sub0')
sub0.text = a
sub1 = ET.SubElement(root, 'sub1')
sub2 = ET.SubElement(sub1, 'sub2')
sub2.text = '2'

tree = ET.ElementTree(root)
tree.write("test.xml")  # 保存
このプログラムを実行すると,以下のようなXMLファイルが作成されます。
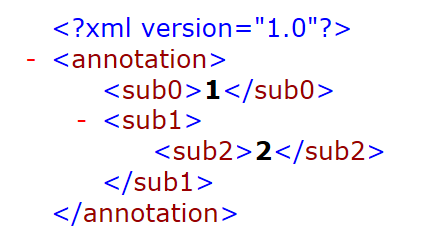 test.xml
僕がここで変なこと言うと訳分からなくなると思うので敢えて説明はしませんが,一つ注意点として,数値を入れる際はstr型に変換しないとエラー吐きます。
※追記(2018/02/25):生成されたXMLデータの画像と,プログラムの内容が違うものになっていたので修正しました。
使い方
ディレクトリに移動して, xml_maker.py を実行してください。
- 画像上でドラッグして矩形選択
- 左の分類カテゴリで,1で選択したオブジェクト名をクリック(確認ダイアログが出ます)
- 同じ画像内に他にもオブジェクトがあれば,1,2の作業を繰り返す。
- オブジェクトをすべて選択し終わったら[Next Image]をクリック。(保存して次の画像に移動します)
1~4の繰り返し。
上の手順でXMLファイルの作成を行うことができます。途中で終了したい場合には[Quit]ボタンをクリックするか,キーボードの”q”を押せば保存して終了します。
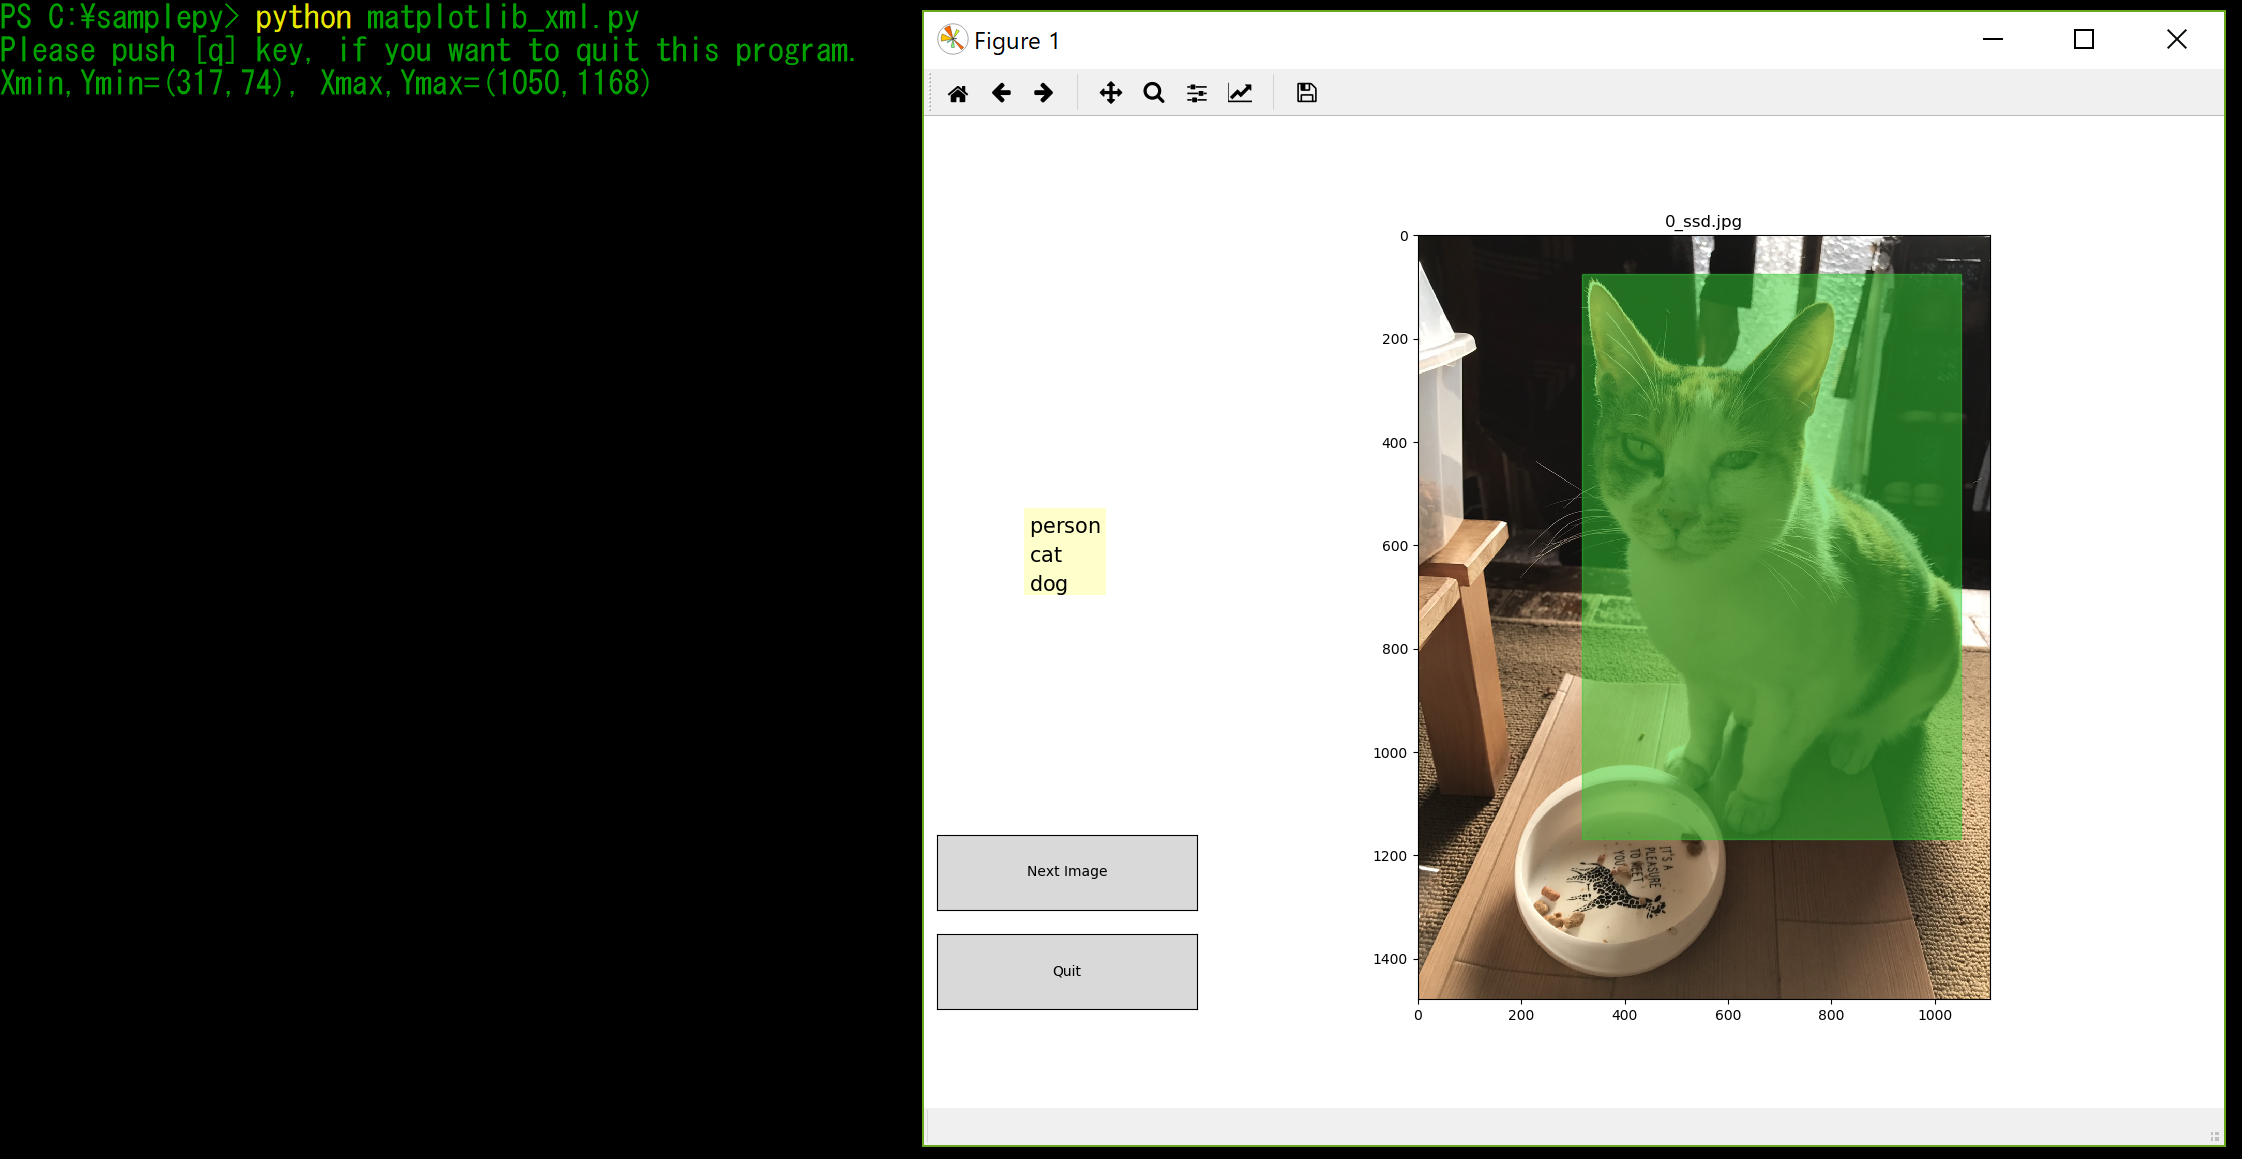
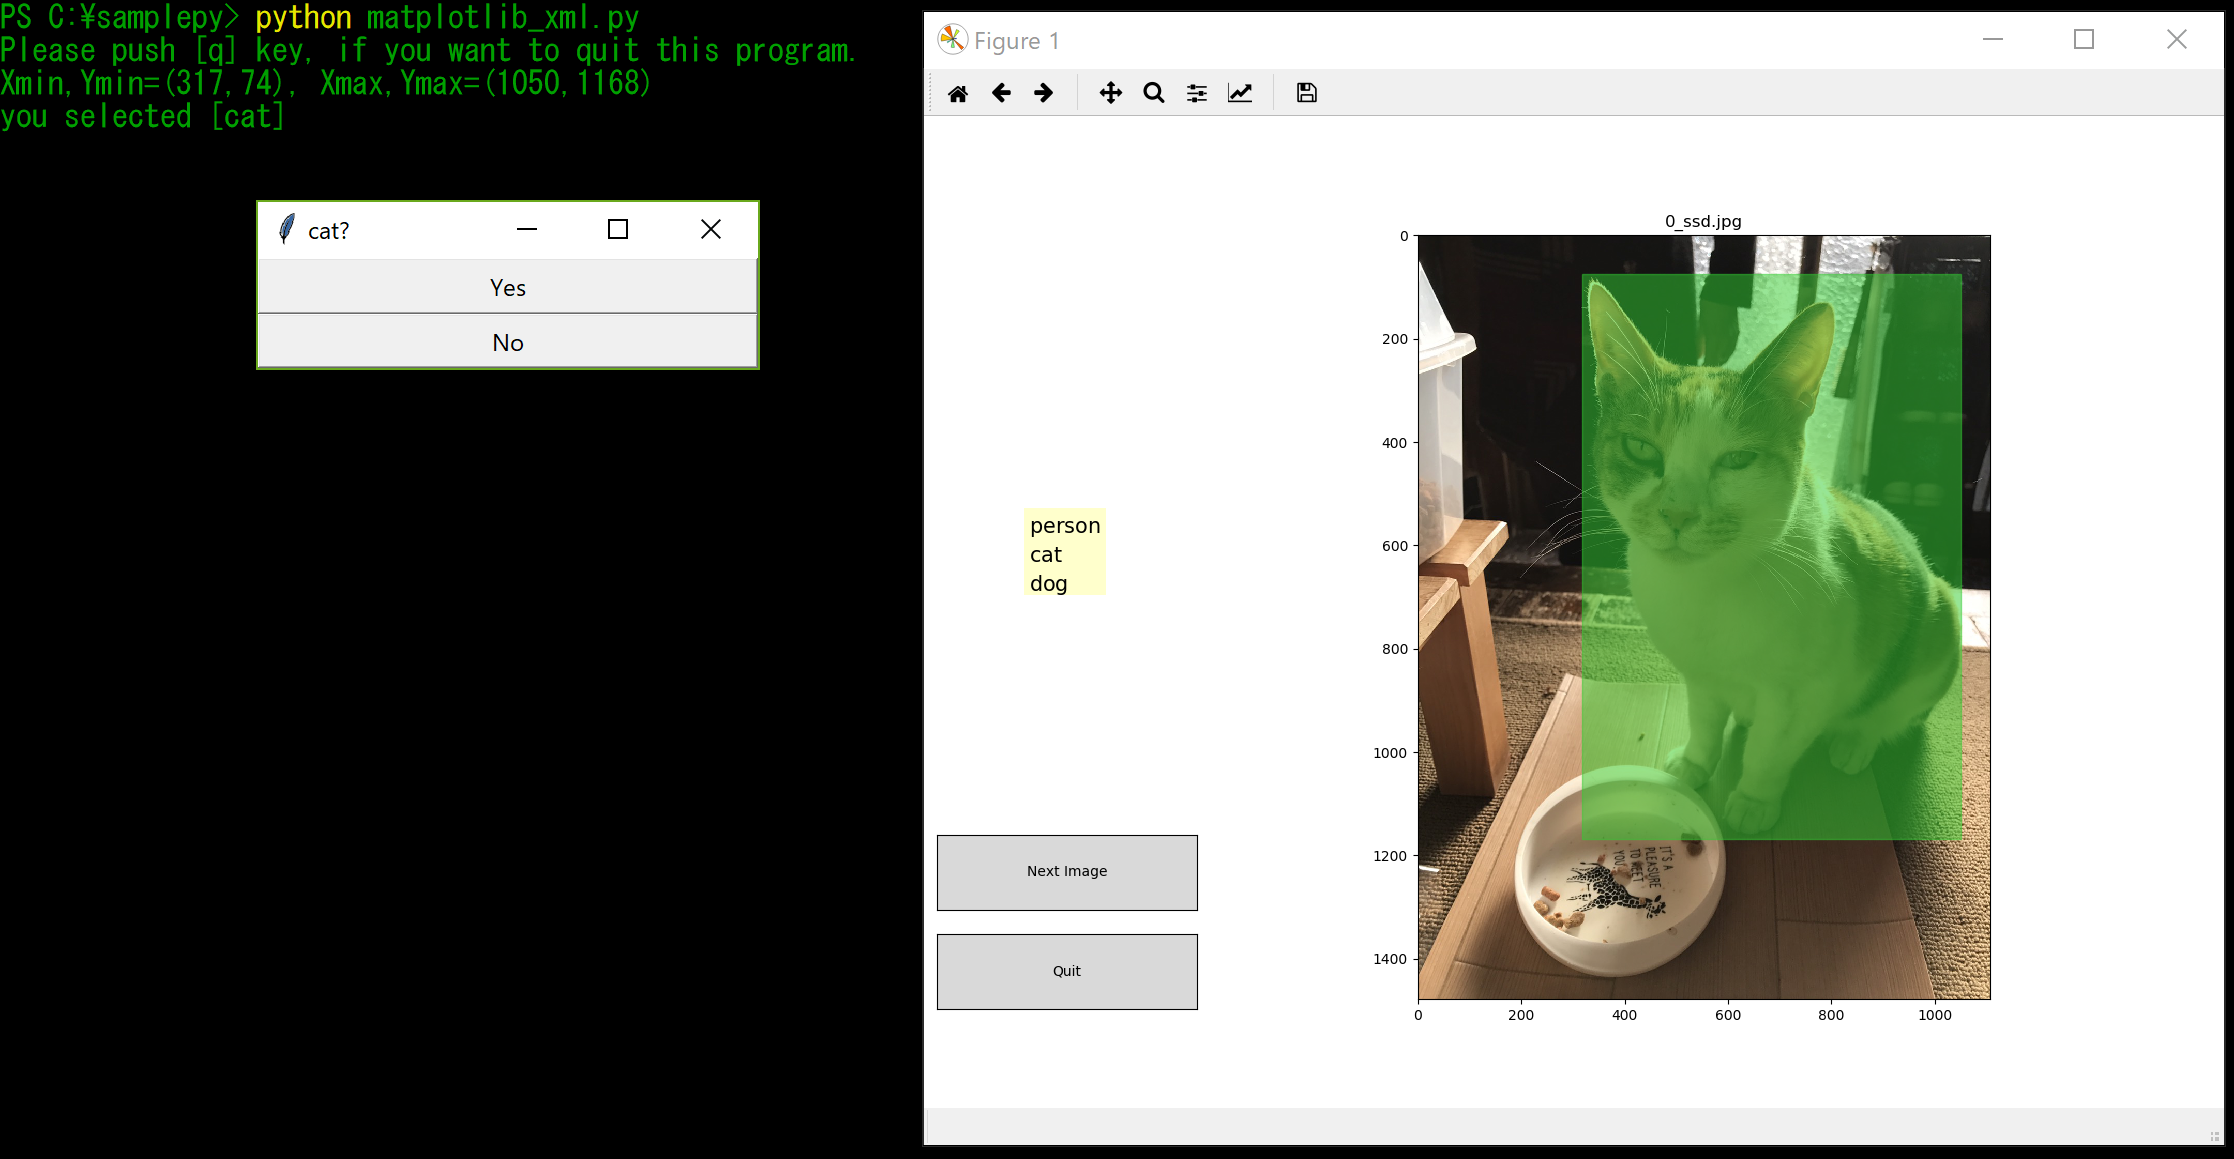
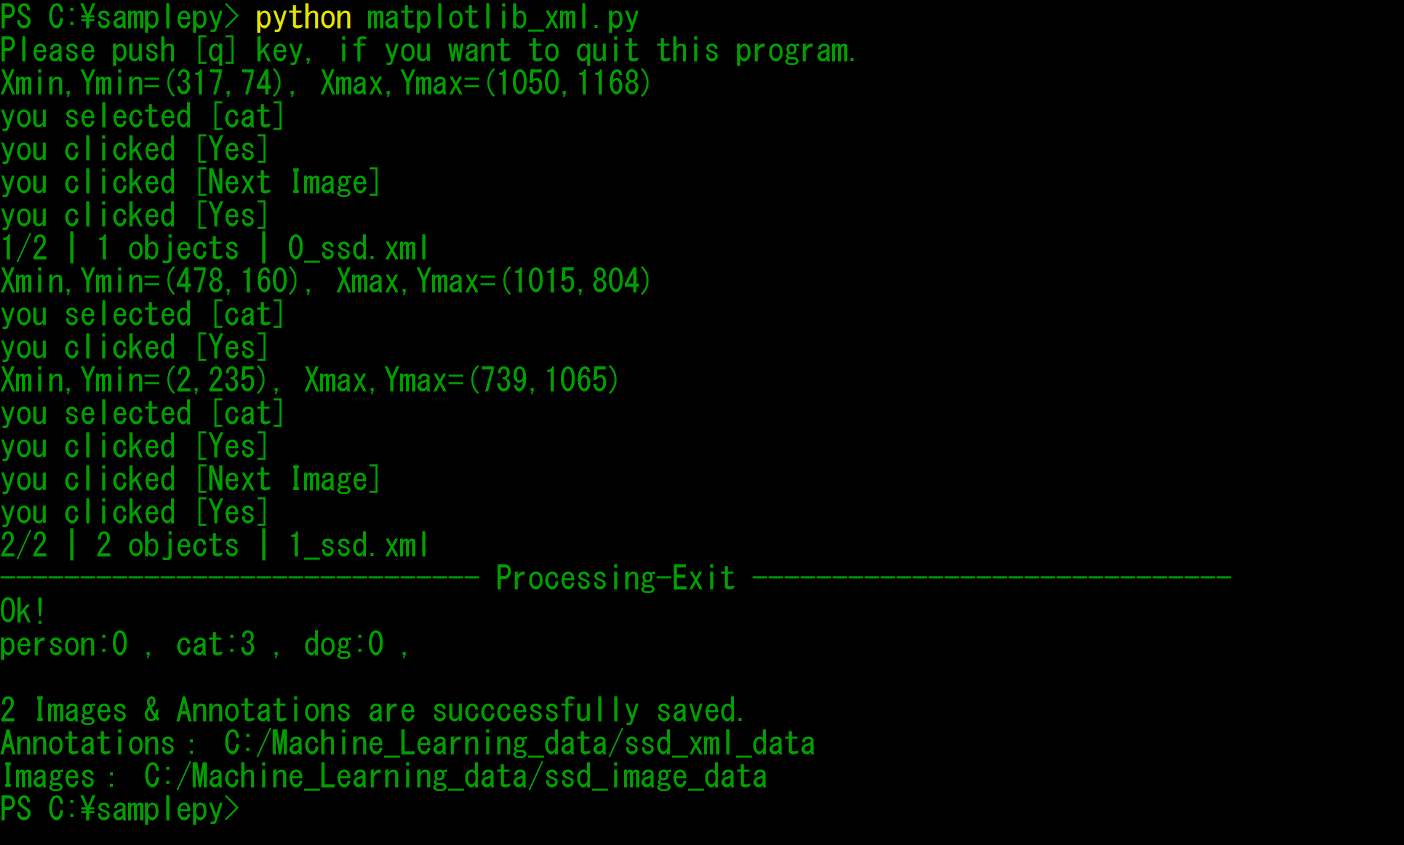
(画像:親戚の家にいるネコ達)
作成されるXMLファイルはこんな感じです。(クリックで拡大できます)
めっちゃ疲れた
最初はTkinterでリストボックスを表示してMatplotlibで矩形選択する方針で作っていましたが,Tkinterのウィンドウ表示と矩形選択モジュールのそれぞれがループ処理しているので上手く表示できず,いろいろ試した結果Matplotlibに機能をまとめることになりました。
改善点はまだいくつかありますが,問題なく使用できるレベルにはなっていると思います。